
Who Lives Downtown?
The Brookings Institution comes through with quantitative evidence that not only proves that downtowns are growing in population, but details who’s living in them. Here’s an edited summary from their Who Lives Downtown report:
An analysis of downtown population, household, and income trends in 44 selected cities from 1970 to 2000 finds that:
– During the 1990s downtown population grew by 10%, a marked resurgence following 20 years of overall decline. 40% of the cities saw growth before the 1990s. From 1970 to 2000, only New York, Seattle, Los Angeles, and San Diego saw steady increases, while 13 downtowns have experienced sustained growth since the 1980s.
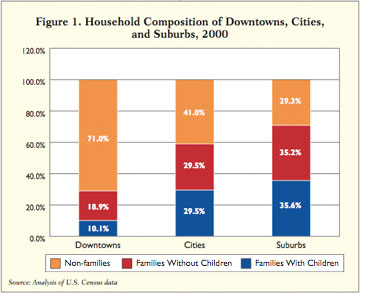
– From 1970 to 2000, the number of downtown households increased 8%, 13% in the 1990s alone. Households grew at a faster rate than population in downtowns, reflecting smaller households of singles, unrelated individuals living together, and childless married couples.
– Downtown homeownership rates more than doubled 1970-2000, reaching 22% by 2000. Overall the number of homeowners grew steadily each decade. By 2000, the share of homeowners across the downtowns swung from a high of 41% in Chicago to a low of just 1% in Cincinnati.
– Downtowns are more racially and ethnically diverse than 20 years ago. From 1980-2000, the combined share of white and black residents living in downtown fell from 81% to 73%, while the share of Hispanic and Asian residents increased. The number of white residents living downtown rebounded in the 1990s, however, despite an overall loss of this group in cities as a whole.
– In general, downtowns boast a higher percentage of both young adults and college-educated residents than the nation’s cities and suburbs. In 2000, 25-34 year olds represented nearly a quarter of the downtown population – up from 13% in 1970. 44% of downtowners had a bachelors degree or higher.
– Downtowns are home to some of the most and least affluent households of their cities and regions. Nearly half of the sample downtowns – such as Midtown Manhattan, Dallas, and Miami – have at least one tract where the median income is higher than that of their MSA as a whole. A large majority have at least one tract 50% or lower than their MSA median.
Leave a Reply