
How the creative class relates to the economy
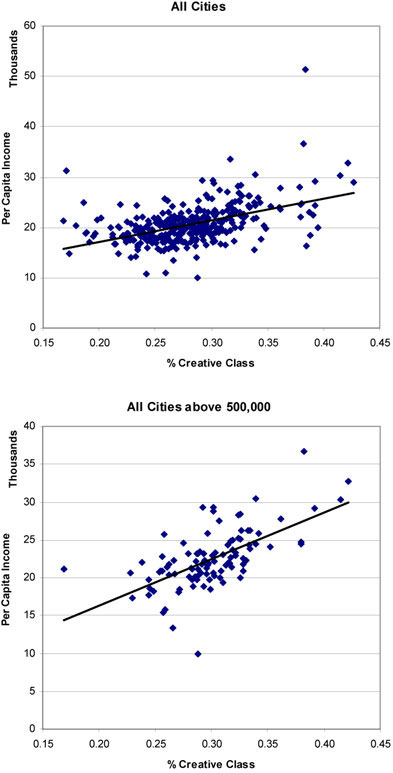
With all the press and writings on the creative class, what sometimes gets lost is the economic bottom line of its impact on cities. These graphs, produced by Creative Class Group research partner Kevin Stolarick based on 2000 data, show it as clearly and succintly as anything out there.
The graphs show regional per capita income as it relates to % of the creative class workforce. The top one represents all 331 Metropolitan Statistical Areas, and the lower one shows only regions with populations above 500K.
Leave a Reply