Highest density of creative class members

The most straightforward measure of the creative class in any city is by density; the number of creative class per square mile. You can download the
Creative Class Group’s rankings with each of their creative class densities here (it only consists of four top ten lists). Below are the top three in each of the population range followed by their creative class members per square mile, with some unexpected cities outside of the usual suspects listed below.
Over one million
1. Los Angeles, CA – 281
2. New York, NY – 269
3. Washington, DC – 226
10. Hartford, CT – 119
500K-Million
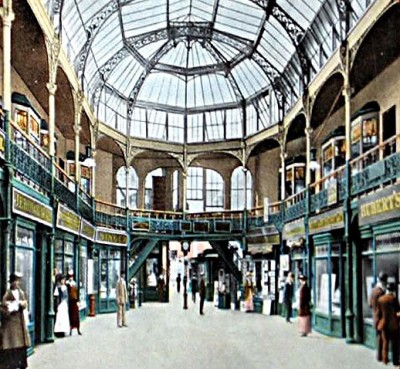
1. Bridgeport, CT – 162 (picture – the upcoming Arcade, a 19th century building renovation targeting artists, design companies and restaurants. Surely we’ll profile this once it opens in the summer.)
2. New Haven, CT – 92
3. Akron, OH – 89
6. El Paso, TX – 58
7 Allentown, PA – 57
At this point, it would probably benefit cities to provide the entire list since many are not exactly household names (again, see their actual creative class densities here)…
250K- 500K
1. Trenton, NJ – 358! (someone from Trenton needs to comment on this…)
2. Ann Arbor, MI – 93
3. Boulder, CO – 74
4. Flint, MI
5. Durham, NC
6. Huntsville, AL
7. Rockford, IL
8. Lancaster, PA
9. Lexington, KY
10. Reading, PA
Under 250K
1. Carson City, NV – 50
2. Santa Cruz, CA – 42
3. Elkhart, IN – 42
4. Warner Robins, GA
5. Bremerton, WA
6. Oshkosh, WI
7. Gainesville, GA
8. Muncie, IN
9. Gainesville, FL
10. Lima, OH
Would readers comment (positive or negative) on any of the cities listed above, outside of LA, NY and DC?

Leave a Reply