
The housing crisis – illustrated
For a simple look at one reason why U.S. residents are having a harder time buying a home each year, or why the housing bubble burst (or the realization that there even was a housing bubble), take a look at the chart above.
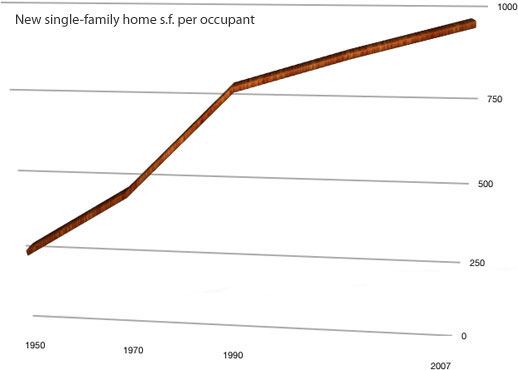
From the U.S. Census, the numbers below state the year, average household size, average new single-family home size (s.f.), and single-family home s.f. per occupant (charted above).
1950 – 3.38 persons – 983 s.f. – 291 s.f.
1970 – 3.11 persons – 1500 s.f. – 482 s.f.
1990 – 2.63 persons – 2080 s.f. – 791 s.f.
2005 – 2.58 persons – 2349 s.f. – 911 s.f.
2006 – 2.57 persons – 2459 s.f. – 957 s.f.
2007 – 2.56 persons – 2479 s.f. – 968 s.f.
That’s the bad news.
The good news is that creatives already knew this, and were long ago focused on urban densities that allow neighborhoods to be walkable, even car free, not coincidentally another industry in crisis. This is why the entry, Cool is ‘not so big’ was written way back in April 2004, and you’ll find countless examples of not-so-big homes in the housing category of this site.
It also explains why multi-family housing ‘starts’ of five or more units were up 80% in the short month of February 2009 over January, vs a 1% gain in single-family homes. In other words, the line on the chart has reached a peak and is starting to come down for the first time starting last year.
*If anyone can find the average size of new single-family-homes built in 2000, please let me know, or comment below.
CoolTown Studios: Please re-do the figure so that every line on the x-y axis is an actual trend line conveying information. Is that gray line supposed to be a shadow? It looks like a trend line attempting to convey data. If it is not data get rid of it. It’s confusing and a very very bad design for communicating data.
Thanks Tina, fixed. Though it’s not everyday you hear ‘bad design’ associated with an Apple product :)